


We have much more to do and your continued support is needed now more than ever.
How to help advance climate equity? Build (and use) a better mapping tool

The presence of riparian wildlife like the rusty crawfish in streams and rivers can indicate resilient ecosystems. Credit: Peter Pearsall/USFWS
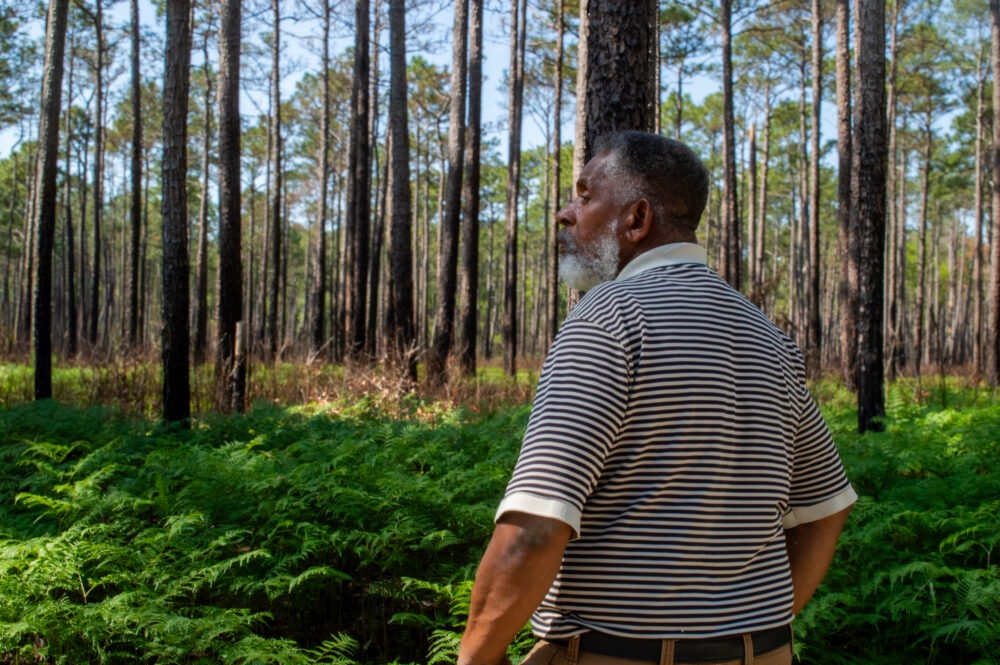
The COVID-19 pandemic was just one of many crises we dealt with in 2021, and continue to deal with. Hurricanes, wildfires, heat waves, drought — in 2021, more than 40 percent of Americans lived in a county that was hit by a climate-related extreme weather event. These events cost lives, and billions of dollars in damage, and they are expected to become more prevalent over the course of the century. Much like the coronavirus pandemic, disadvantaged communities across the country are disproportionately subjected to climate impacts, with major impacts on their health and wellbeing.
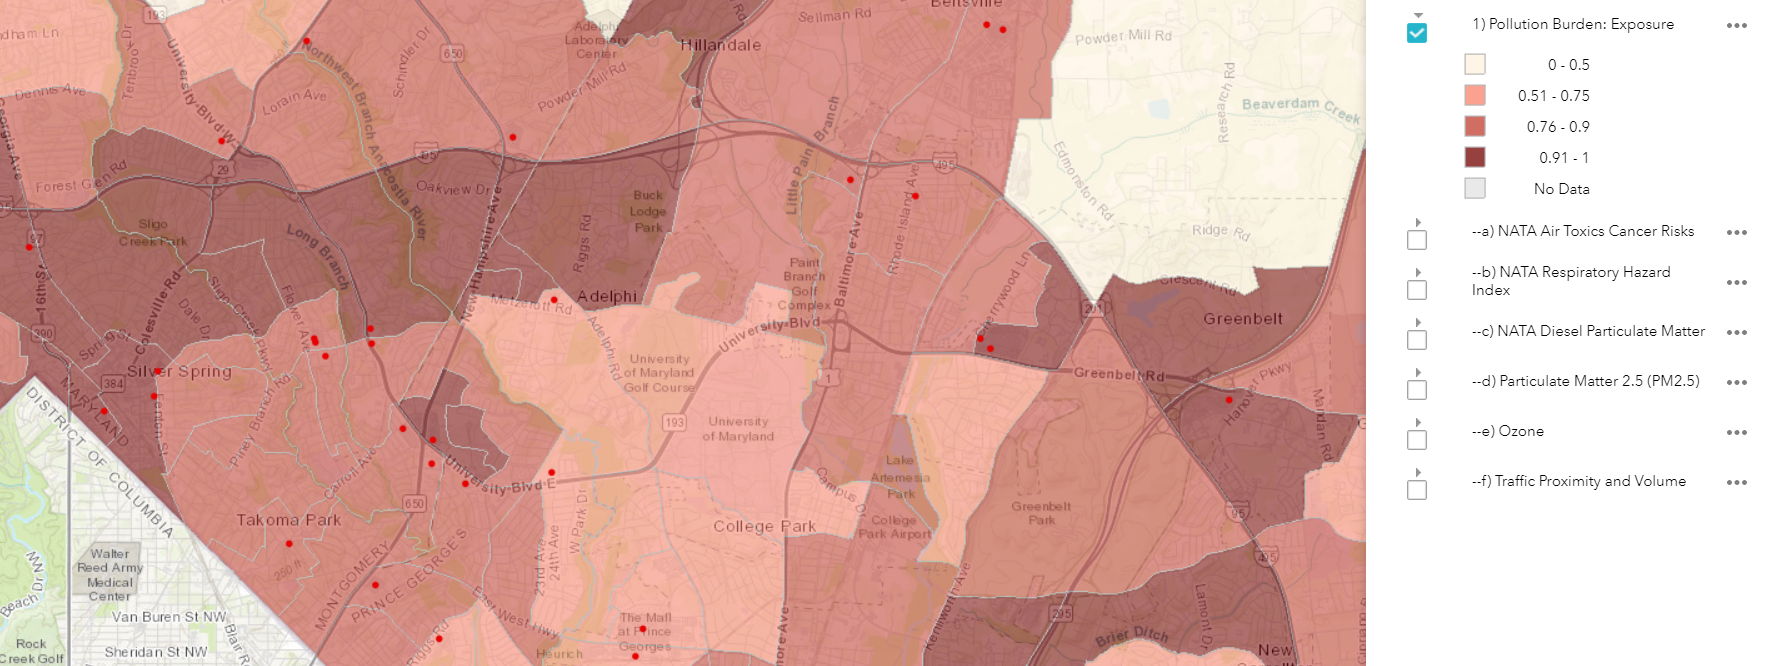
Environmental Justice Screening and Mapping (EJSM) tools are a useful way of visualizing and analyzing these impacts. Existing national and state-level EJSM tools illustrate the ways climate change and pollution effects vary across different communities. Current tools, however, often omit crucial data on topics like economic progress, climate equity and resilience, health disparities, and more. These gaps can prevent scientists, community-based organizations, and legislators from identifying which communities face the greatest burden from climate change. And they can deter us from measuring progress towards building resistance against extreme climate events and environmental injustice.
A new report from the Center for Community Engagement, Environmental Justice, and Health at the University of Maryland, in partnership with the National Wildlife Federation, explores these gaps in existing EJSM tools and offers solutions for how to fill them — to ensure these tools better represent topics like climate equity and resilience, and drive equitable decision-making to build healthy, sustainable, and resilient communities.
A more holistic mapping tool
EJSM tools can reveal which communities face the greatest burden from environmental injustice and climate change. Incorporating these tools into policy can help target resources to reduce these disproportionate impacts. For more background on what these tools are — and recommended best practices for EJSM tool development, check out our previous blog on these tools, and their use and potential in policy making to address climate change.
In general, EJSM tools include two kinds of indicators: environmental and demographic. Environmental indicators tend to describe the physical environment — things like green space, traffic density, or water quality. Demographic indicators provide information about a community’s potential susceptibility to environmental exposures. Examples include poverty level, race and ethnicity data, and level of education.
The new report, Gaps in Environmental Justice Screening and Mapping Tools and Potential New Indicators, proposes a suite of new indicator themes: measures of social and economic progress, health, resiliency, and more. It is only with these kinds of indicators that we can have a holistic, accurate understanding of environmental justice, and climate equity and justice.
Understanding Indicators
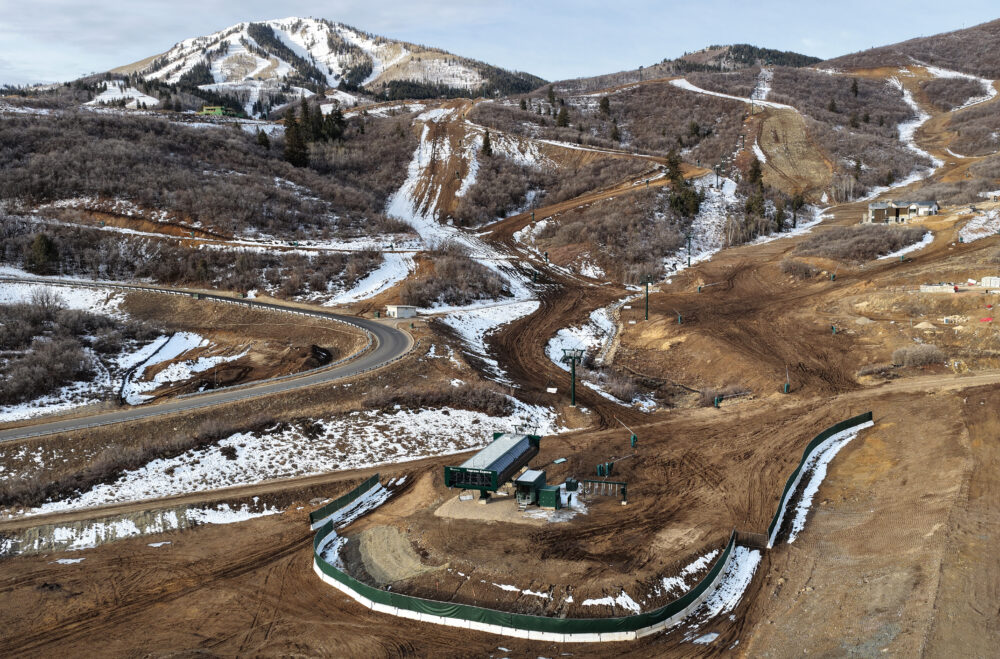
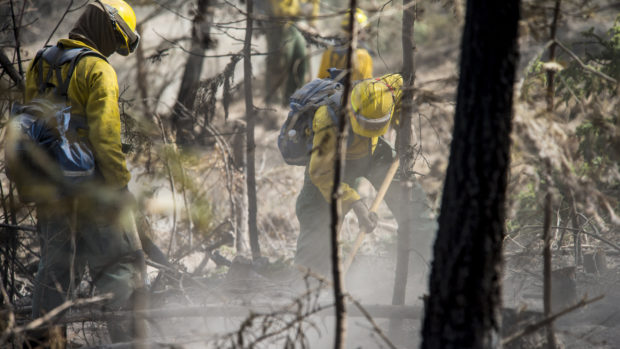
Resilience indicators, for example, help us understand the capacity of a community to not only respond to a climate-fueled natural disaster but to withstand it, and to recover from it. Analyzing resilience is only going to become more important as climate change magnifies the frequency and severity of natural disasters.

Examples of resilience indicators include the number of elevated homes (good for understanding flood resiliency in a coastal community) and the percent of households with air conditioning (good for understanding how resilient a community might be to extreme heat). Indicators of wildlife and ecological health are also important measures of resilience — data on wildlife abundance, for example, or levels of ecosystem stewardship by private landowners — because we know that healthy forests, farms, and other natural spaces can protect human and wildlife communities from climate change.
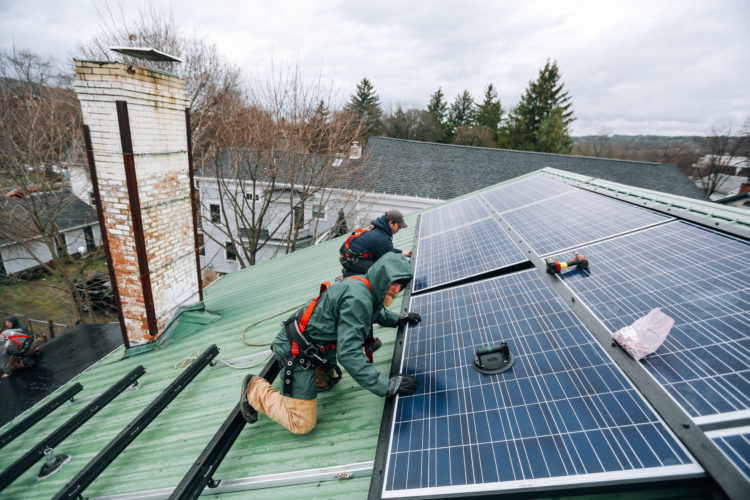
Economic progress is another topic largely missing from current EJSM tools. Indicators to measure economic progress include things like “increase in minimum wage” and “energy burden” (how much of your household income is spent on energy costs).
On the surface, these metrics may not seem very climate-related. But measuring economic growth and stability is actually key to understanding how a community might respond to climate change. We know that low-income communities are much more vulnerable to climate impacts than high or medium-income ones, and research has shown the ability to absorb climate stress — to be climate resilient — is connected to all sorts of economic-related factors.

Tool application in policy and decision making
Including a more comprehensive suite of indicators into EJSM tools is essential if we want these tools to better represent climate equity, climate resilience, and climate impacts. But improving the tools is just the first step. The next is integrating them into policy and decision-making, to better protect vulnerable communities.
The report includes a series of recommendations to do just that, including:
- Communicate and brainstorm indicators with community members. EJSM tools are most effective when they reflect a community’s values and priorities. Ensuring communities can participate in tool development adds credibility, builds trust with disadvantaged communities, and promotes cultural competence.
- Train decision-makers on how to use the tool.
- Use EJSM tools to inform how federal funds are distributed. By using EJSM tools to target underserved communities, federal funding can be distributed to drive positive change.
To read the full paper in full and learn more about the policy recommendations, click here. Or visit NWF’s Climate Change and Communities webpage to learn about how climate vulnerability affects communities within the U.S.
