


We have much more to do and your continued support is needed now more than ever.
Environmental Justice Mapping Tools: Use and Potential in Policy Making to Address Climate Change
Mapping tools can reveal which communities face the greatest burden from environmental injustice and climate change. Incorporating these tools into policy can help target resources to reduce these disproportionate impacts.
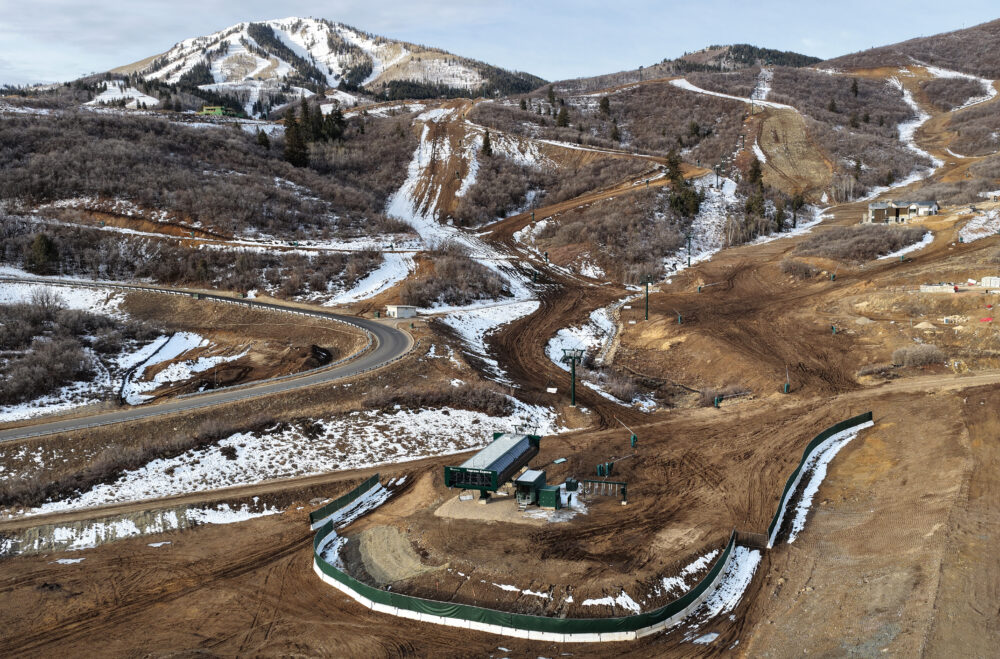
Green spaces benefit people and wildlife alike. In cities, green spaces can store water to provide flood protection and create shade to reduce the “urban heat island effect.” As climate effects continue to exacerbate natural disasters, such as hurricanes and extreme heat, the importance of protective natural features like green spaces will only increase. Green spaces also provide habitat for wildlife, and crucial recreation and educational opportunities for millions of Americans.
However, a recent report by the Center for American Progress (CAP) found that in the U.S. people of color are more likely than white people to live in nature-deprived areas and that low-income communities are also more likely to experience nature deprivation. This inequity has implications for public health, wellbeing, and resilience to climate change. And, it is just one inequity that many American communities face with regards to the environment and climate.

All communities do not experience climate change or pollution burdens to the same degree or in the same way. For instance, natural disasters are becoming more frequent and severe due to climate change. Federal disaster recovery assistance, however, tends to favor wealthy, home-owning, white residents. A 2018 study found that in the U.S. as hazard damages increase in an area, so does wealth inequality along lines of race, education, and homeownership. The study found that the more FEMA aid an area receives, the more wealth gaps grow between those who are socioeconomically disadvantaged and those who are not.
Geographic, social, and economic factors all affect communities’ vulnerability to climate effects and environmental hazards. For example, extreme heat is a bigger threat to those living in Arizona or Texas when compared with Maine or North Dakota. Even in regions where extreme heat is most deadly, communities that have been historically disinvested in are likely to face the greatest challenges. Lack of heat-reducing green space, lack of structural adaptations such as air conditioning, and high rates of health conditions like asthma can make communities more vulnerable to heat-related illnesses too.
Environmental justice communities often face disproportionate exposure to environmental hazards or increased vulnerability to hazards. Environmental justice screening and mapping (EJSM) tools illustrate these varied environmental burdens, which can be important for education and advocacy. Moreover, EJSM tools can help drive more effective decision-making at the state and federal levels to build healthy, resilient, and equitable communities. A new white paper from the National Wildlife Federation, Environmental Justice Mapping Tools: Use and Potential in Policy Making to Address Climate Change, shows how these EJSM tools can be powerful allies in the fight for justice and equitable access to climate solutions, and includes specific recommendations on how to integrate the tools into policymaking.
What are EJSM tools?
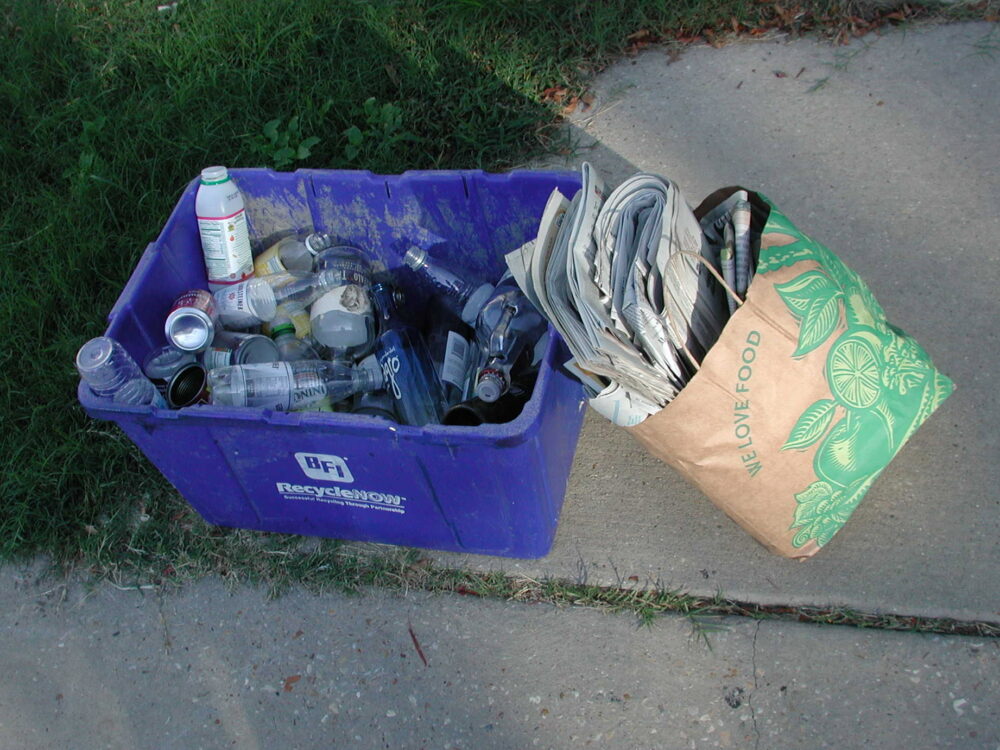
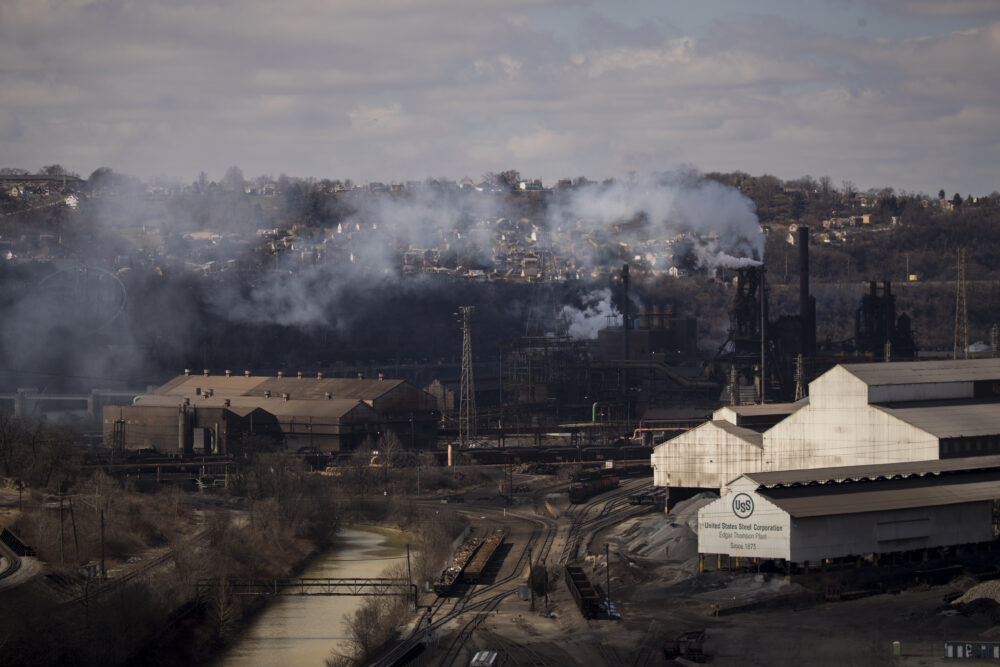
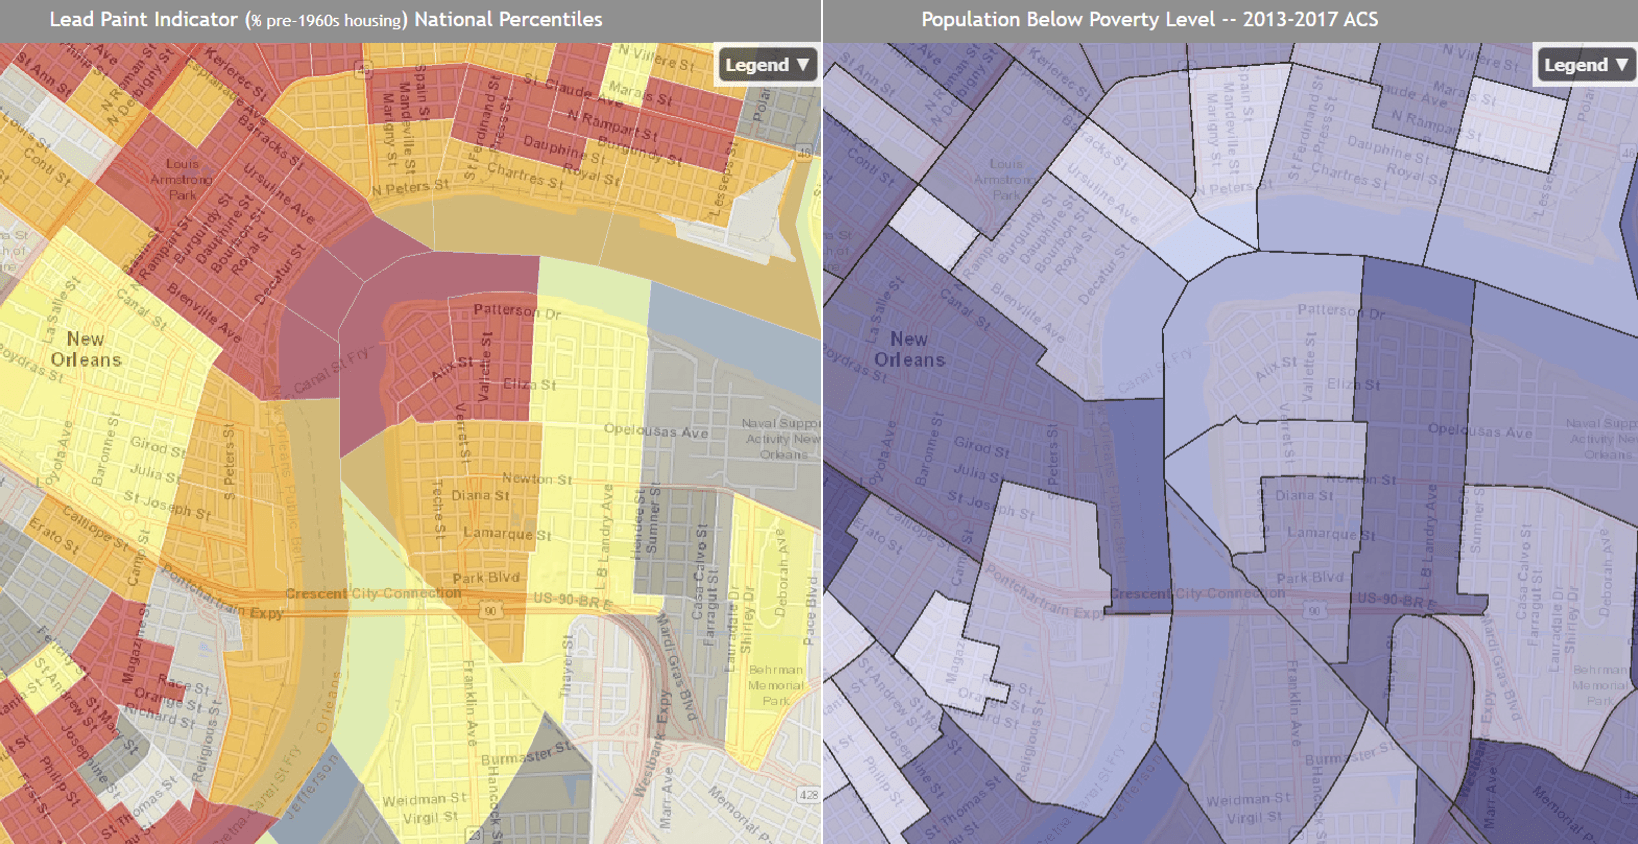
Environmental Justice Screening and Mapping (EJSM) tools combine data and mapping to allow users to visualize patterns of environmental and climate hazards. At the heart of these tools, and the environmental justice movement, is the concept of disproportionate impacts. EJSM tools can show where the effects of pollution and climate burdens overlap and compound each other, and where they do not. In this way, they help reveal which communities are and aren’t at risk from particular or cumulative burdens. For instance, EJSM tools could show which communities are located in close proximity to polluting facilities or high-volume transportation corridors.
These tools also map demographic factors, like the percent of a population that is low-income, non-white, or linguistically isolated; these factors affect both a community’s environmental burden and its climate vulnerability. Residents without cars or access to reliable transportation, for example, may have difficulty evacuating safely during climate-fueled disasters, and those with underlying health conditions may be more susceptible to air pollution worsened by increasing heat.
What are some best practices for EJSM tool development?
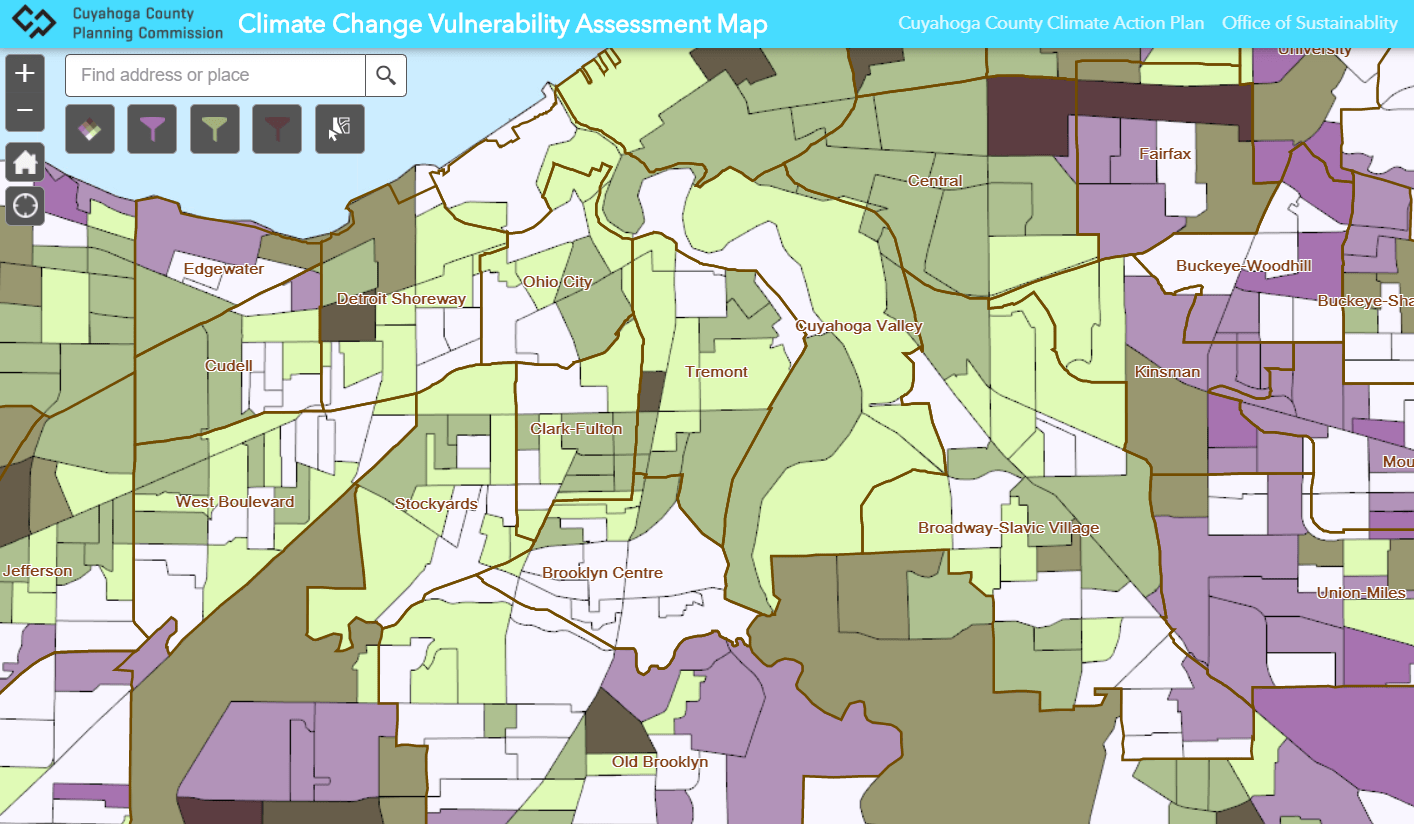
The new white paper includes best practices for EJSM tools, one of which is to include climate indicators in the tools themselves. This is crucial because it can help give a more holistic picture of the cumulative burdens that communities face. Climate indicators can be things like sea level rise, wildfire risk, and current and future flood zones. This Vulnerability Assessment Map from Ohio’s Cuyahoga County’s Planning Commission is one example of a climate vulnerability tool.
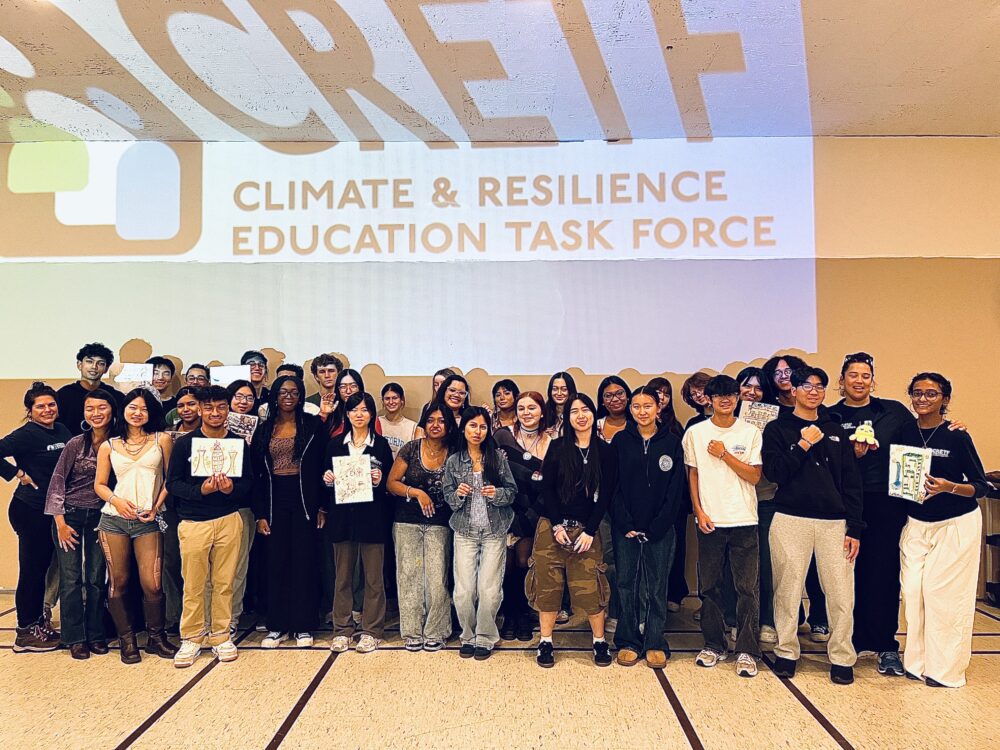
Given a long and persistent history of disenfranchisement of environmental justice communities, community input is especially crucial during the creation of EJSM tools—and is identified in the white paper as another recommended best practice for tool development. Those living in environmental justice communities are likely to know best whether data about asthma attacks, fertilizer use, or lack of green space reflect the challenges and needs of their community. When these tools are designed well, communities can also use them as third party validation for their experiences.
How can EJSM tools be better integrated into smart policy?
Below we highlight a few of the ways EJSM tools could be better incorporated into policy from the recommendations of Environmental Justice Mapping Tools: Use and Potential in Policy Making to Address Climate Change.
- Ensure that EJSM tools are properly funded and maintained. This is a necessary first step for these tools to be effective. By requiring the Environmental Protection Agency to update their national EJSM tool (EPA EJSCREEN), Congress could ensure that the tool remains useful. Greater funding and state input could allow the tool to be more user-friendly and include more timely, relevant data.
- EJSM tools should be incorporated into legislation and should be used in government agency decisions that affect the environment or climate such as decisions regarding permitting industrial facilities or prioritizing government spending and hazard clean up. Incorporating EJSM tools into legislation could also help direct funds to environmental justice communities to lessen cumulative burdens while improving health and quality of life.
- Infuse EJSM tools into COVID-19-related responses and other stimulus spending. Investments designed to help communities respond to and recover from COVID-19 must go to those that need it most. By employing EJSM tools in funding decisions, Congress can help maximize the effectiveness of each dollar spent and address the moral failings of systemic racism.
- Require states to develop, maintain, and use their own state-wide EJSM tools to be eligible for federal funding related to the environment or climate. In this way, Congress can help ensure that useful EJSM tools are available for communities and policymakers alike, especially since state-level tools can incorporate relevant data that may not be available nationally.
To read the white paper in full and learn more about best practices and policy recommendations for EJSM tools, click here. Or visit NWF’s Climate Change and Communities webpage to learn about how climate vulnerability affects communities within the U.S. And join our webinar on Monday, March 22 at 4 PM where experts will highlight lessons learned from existing local and regional mapping tools and efforts to inform these current national discussions.
