


We have much more to do and your continued support is needed now more than ever.
The New Normal Is Already a Loss: How Shifting Baselines Skew Our View of Nature

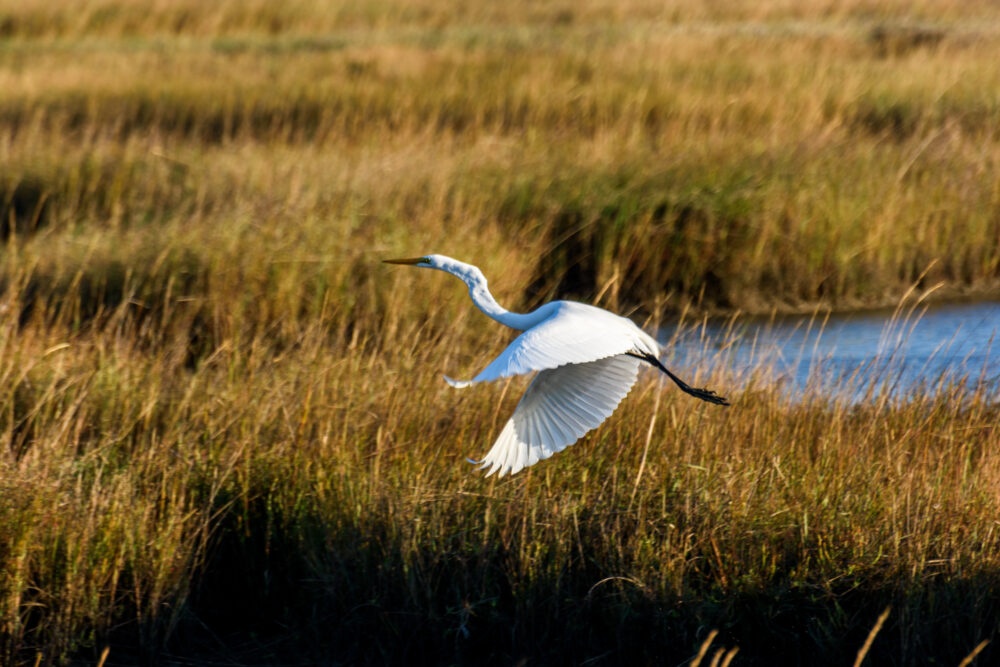
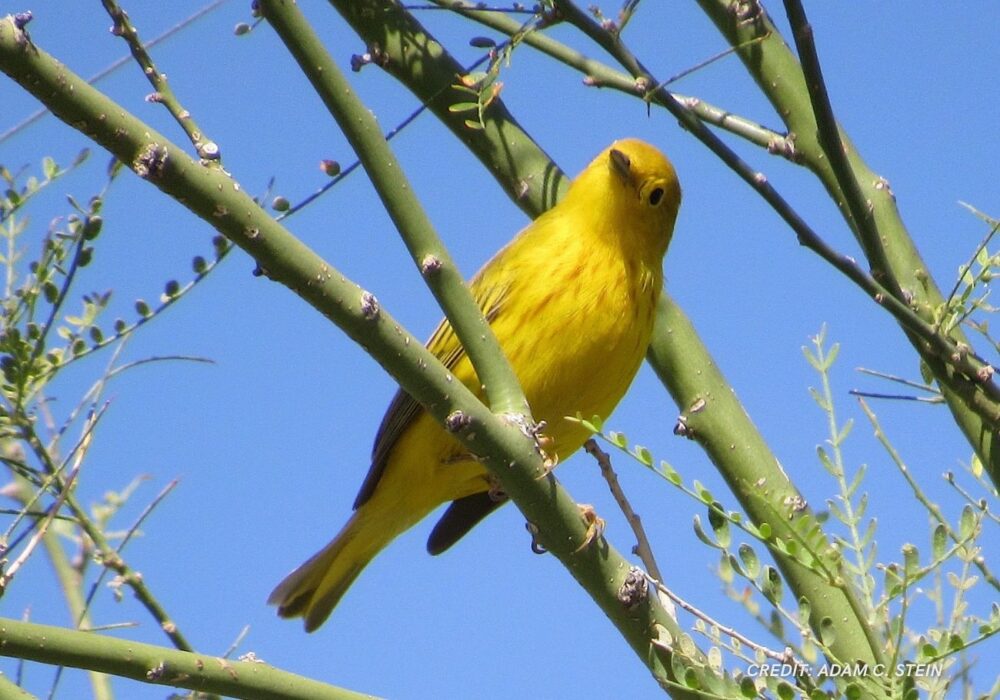
Veery. Credit: Courtney Celley/USFWS
As children, the natural world we grow up in is the only reference point we have. However, with each generation, our perception of the natural world changes, and with it, our understanding of what accounts for abundance and loss of biodiversity. A term bandied about is the “new normal.” In ecology, it’s called the shifting baseline syndrome.
Resetting the Reference Point
Think back on the bird song you woke up to this morning. You might have pulled out a few recognizable threads, perhaps the robin, the crow, the sparrow. Now imagine what morning might have sounded like to your grandparents. Major scientific studies indicate that it was likely a cacophony of song by comparison—many different kinds of birds and more of them. The difference, the shift in normal, is gradual over time and the loss, without memory or data, is hard to define.
Enter shifting baseline syndrome, which was coined in 1995, not by an ornithologist, but by a marine biologist Daniel Pauly, who was focused on fish stocks. He described the phenomenon as a “collective amnesia” and warned that underestimating ecological degradation could lead to the mismanagement of fisheries—and other conservation efforts more broadly.
From pollinators and native plants to coral reefs and Pacific salmon runs, shifting baseline syndrome quietly reshapes our understanding of what’s “normal” in the natural world. This phenomenon occurs when each new generation accepts a new normal, which is in fact a diminished state of the ecosystem and unaware of the abundance that existed prior.
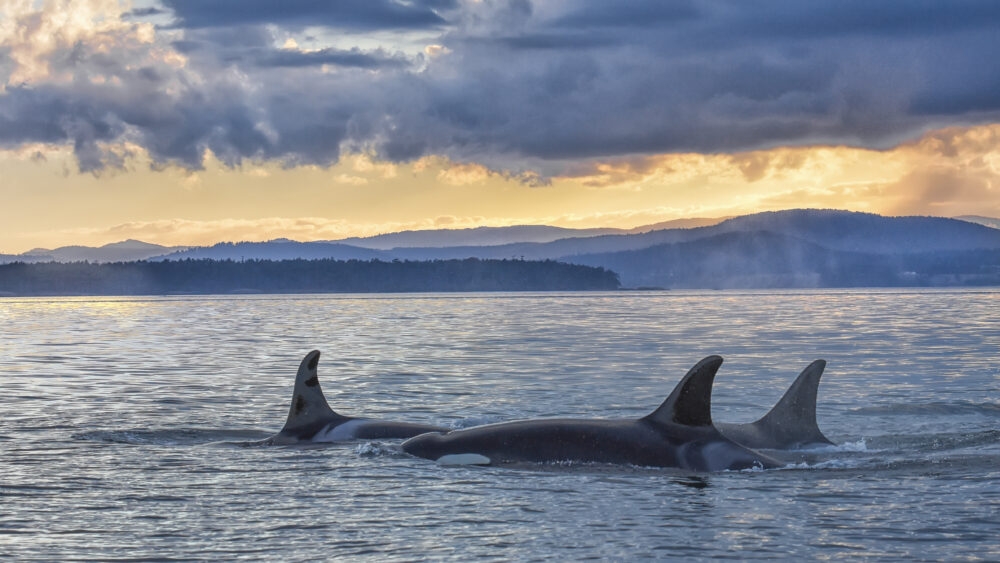
When we talk about biodiversity loss, it’s not just about the diminishing numbers and the disappearance of species, but also the size and range of the populations that remain. Take the case of salmon: previous generations saw these fish in far greater numbers and at much larger sizes. Historical photos and diary entries boast of catches weighing more than a hundred pounds. These massive fish not only supported thriving fisheries but were also a crucial food source for orcas, bears, and entire river ecosystems.
But over time, salmon grew fewer and smaller largely due to dams and habitat loss. Today, fishermen return to the rivers and the ocean with very different expectations—and likely unaware of the abundance that once existed. Today’s depleted runs are seen as the norm, sadly. It’s a reset on the reference point and the result shapes how we view ecological loss—and conservation goals.
The Windshield Tells the Story
If we pay attention over time, we can all be witnesses to a shifting baseline. A striking example came in 2017, when a study out of Germany sought to answer an unusual—but very telling—question: Where did all the bug splatter go?
Decades ago, cleaning the dead bugs off the windshield was central to any road trip. Over time, however, this began to change. There were fewer and fewer bugs. In 1989, what began as a casual observation evolved into a scientific study, the Krefeld Study—and the results were staggering. Flying insects in nature reserves had plunged by more than 75 percent over 27 years.
The study reveals a concerning drop in insect populations, and it also underscores the limits of much of our ecological research, for it only dates back to 1989. This is a relatively narrow window in time, which doesn’t offer a glimpse into insect populations prior to the industrial age, the use of pesticides and dramatic shifts in healthy habitat. As a result, we can expect that the study baseline was already significantly diminished. The study’s results risk reinforcing or normalizing the shifting baseline.

A Little Dash of Context Goes a Long Way
Shifting baseline syndrome challenges how we interpret environmental data over time—not because the science is faulty, but because the starting point for what’s considered ‘normal’ may already reflect ecological decline.
So how do scientists then go about their research when there is a lack of historical data?
This is where creative problem-solving and an interdisciplinary approach comes into play.
One example takes us back to the salmon of the Columbia River Basin. These fish have been systematically recorded since 1938, coinciding with the completion of Bonneville Dam. However, if we use 1938 as a baseline to shape conservation goals, it’s important to consider the impacts of habitat change, overfishing and the construction of dams prior to 1938.
What did these fish runs look like before the arrival of settlers? While we may never know precise population numbers, archaeological evidence and Indigenous oral histories offer insight into the historical abundance of salmon and steelhead runs.
And we have additional clues. Remember the historical photos and diary entries boasting the big catch? They date back to 1910 and recorded the fish weights exceeding 100 pounds. Ultimately, science has pieced together the puzzle of the Columbia River salmon runs, and estimates suggest 15-20 million salmon and steelhead returned annually before major development.
While not perfect, this example underscores the value of collaboration with historians and anthropologists and incorporating indigenous knowledge as we look to understand what our world looked like before widescale human impact and climate change.
Some studies can benefit from the use of paleodata, such as sediment cores and pollen analysis to estimate past population sizes and ecosystem conditions. Tree rings also offer clues. Modeling and long-term data sets are additional tools. And perhaps most importantly, transparency is key. Scientists must be up front and communicate the uncertainty surrounding their baseline data. It’s fair to say: We don’t know what we don’t know.
